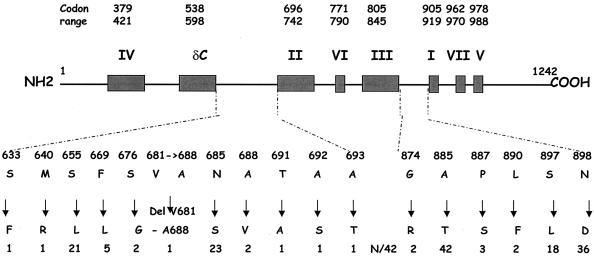
FIG. 1.
Human CMV DNA polymerase natural polymorphism map. Shown at the top are the conserved functional domains and their codon ranges (boxed). Below the boxes are the loci of amino acid changes. These changes are then shown mapped to the natural polymorphism in the clinical isolates. The number (N) of isolates (total, 42) harboring each change is shown at the bottom of the figure.

