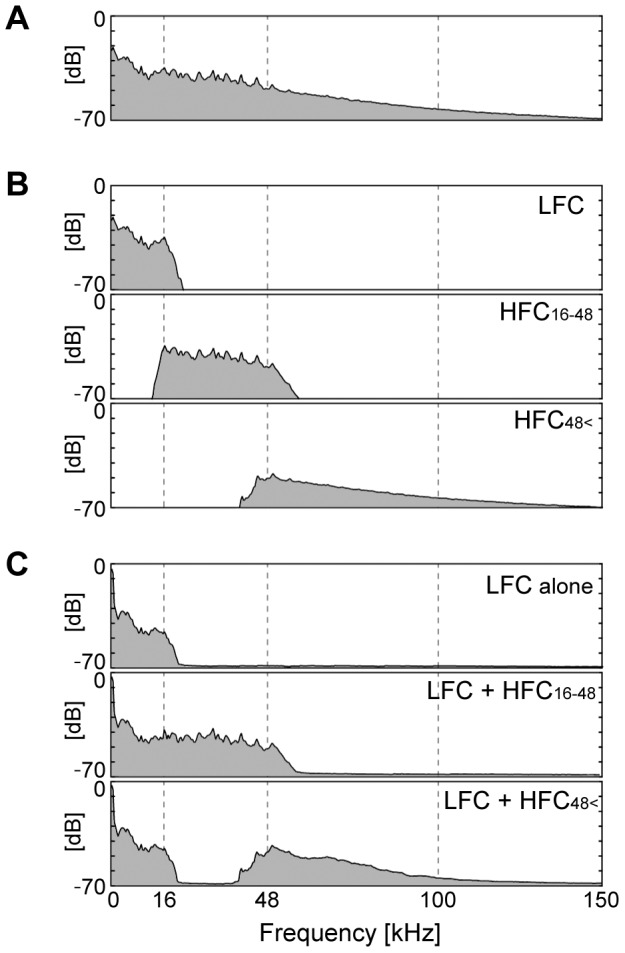
Figure 2. Averaged power spectra of sound materials applied in Experiment 1.

A: Electric signal of the sound source. B: Filtered electric signals of LFC under 16 kHz (control), HFC at 16–48 kHz, and HFC at 48 kHz <. C: The sounds and air vibration reproduced by the frequency-variable sound application system. Power was calculated from the data recorded at the subject's position. Faithful reproductions from electric signals to air vibrations were observed.
