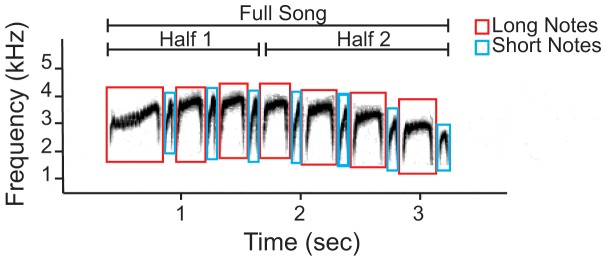
Figure 3. Acoustic analysis of Hylophylax naevioides song.

Broadband spectrogram illustrates an example of one song produced by a wild adult male. Boxes denote the acoustic selections used in this study to calculate acoustic parameters using robust statistical estimators in Raven 1.4. Parameters were calculated as averages across five different subsets of notes separately: the full song, the first half of the song by the nearest note to the middle time, the second half of the song by the nearest note to the middle time, the long notes and the short notes (see Table 1).
