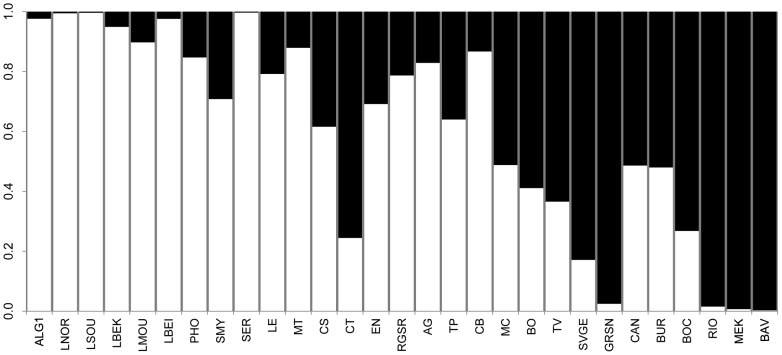
Figure 2. Discriminant Analysis of Principal Components (DAPC) based on Y-chromosome sPC1-identified structure.
The barplot represents DAPC-based posterior membership probabilities for each of the considered populations to belong at each of the two sPC1-identified groups (white = South-Eastern Mediterranean; black = North-Western Mediterranean). Population codes as in Table S1.

