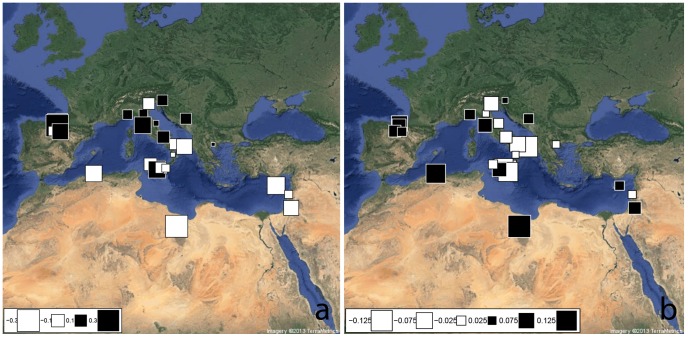
Figure 3. Spatial Principal Component Analysis (sPCA) based on mtDNA haplogroups frequencies.
The first two global components sPC1 (a) and sPC2 (b) are depicted. Positive values are represented by black squares; negative values are represented by white squares; the size of the square is proportional to the absolute value of sPC scores.

