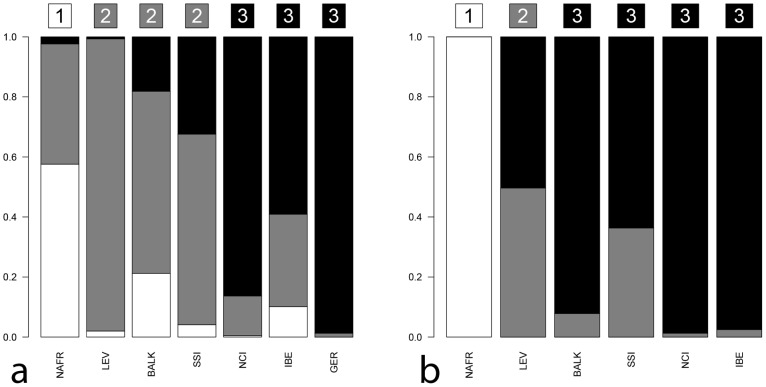
Figure 4. Admixture-like barplots for Y-chromosome (a) and mtDNA (b).
The barplots represent DAPC-based posterior membership probabilities for each of the considered populations and for each inferred cluster (mclust algorithm). The affiliation of each population to a given cluster and its corresponding colour code are represented by letters (within coloured squares) on the top of each bar. Labels: NAFR: North-Africa, LEV: Levant, BALK: Balkans, SSI: Sicily and South-Italy, NCI: North-Central Italy, IBE: Iberian Peninsula, GER: Germany.

