
Figure 2. Figure 2 shows Kernel density estimates for the distribution of prediction errors for the four calibration data scenarios considered: (1) no calibration data, (2) resting heart rate and energy expenditure, (3) resting and peak heart rates and energy expenditures, and (4) all five levels of heart rate and energy expenditure.
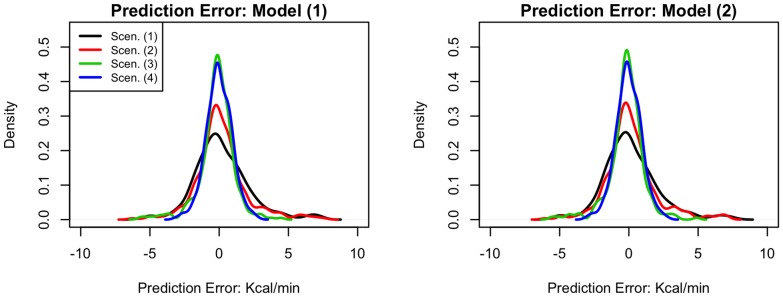
The left panel shows prediction errors computed under model (1), which uses four age/gender categories to predict energy expenditure, and the right panel prediction errors computed under model (2), which uses gender and age as continuous variables, and their interaction to predict energy expenditure.