
Figure 3. Figure 3 shows an Illustration of the difference between population-level and individual-level relationships between heart rate and energy expenditure.
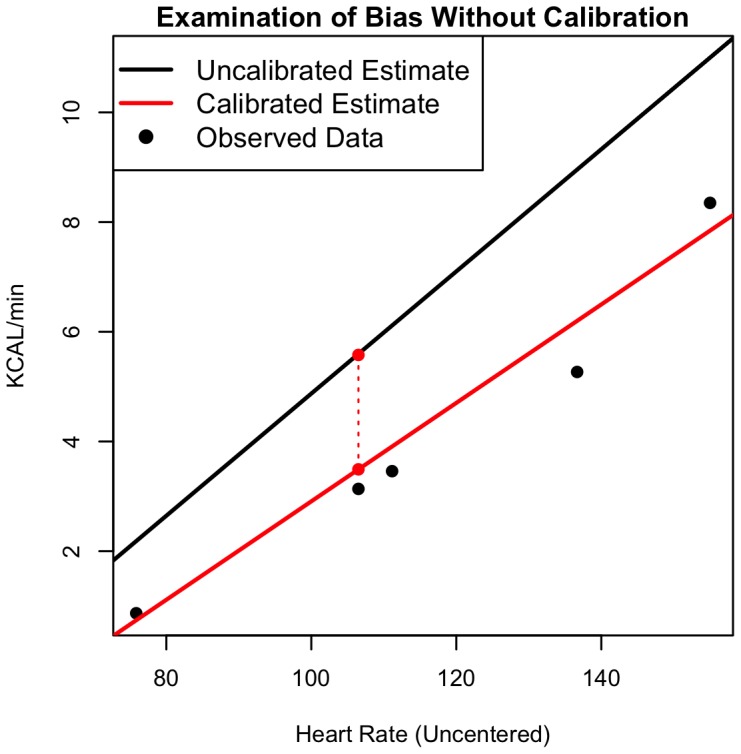
The solid black is the population equation, estimated from the subject's age and sex, omitting subject-specific random effects; the solid red line is the subject equation including the subject-level random-effects; and the vertical dashed red line shows the difference between the population-level and subject-level equations at the slow walking heart rate.