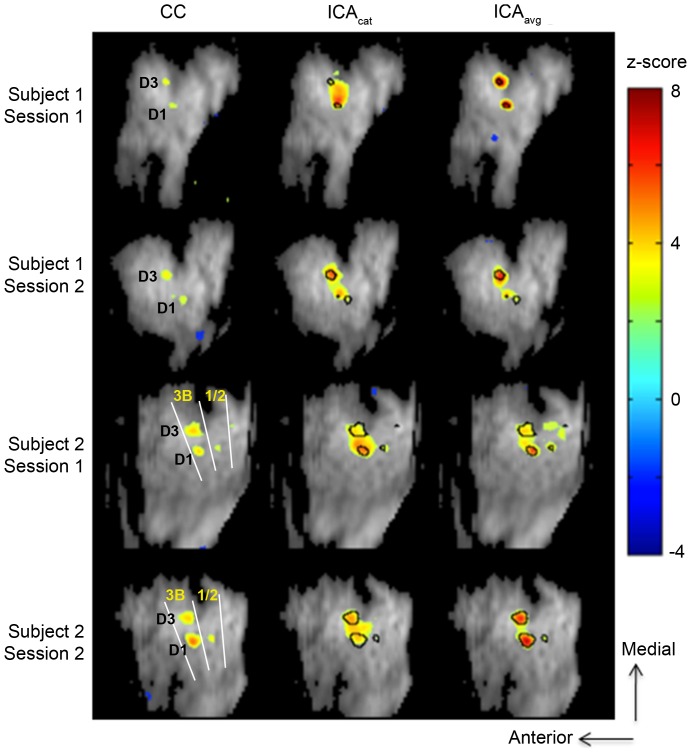
Figure 2. Activation maps obtained using cross-correlation analysis (CC), ICAcat and ICAavg (|z|>2.5).
In general, ICA provides greater contrast (in terms of z-score) between activated and non-activated brain regions. Compared with ICAcat, ICAavg provides greater functional specificity and contrast. The results are consistent across subjects and sessions. These maps correspond to nIC estimated using the bootstrap stability analysis approach (nIC = (9.8±1.2)).

