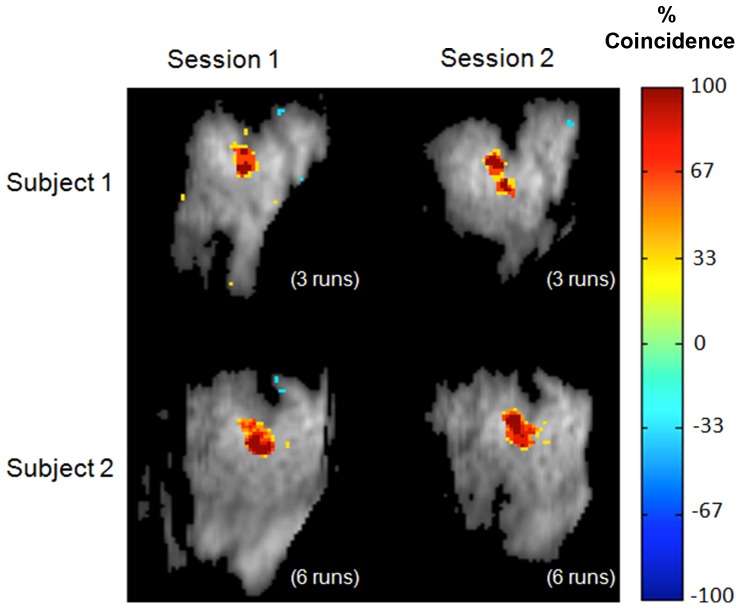
Figure 5. High run-to-run reproducibility of activation maps obtained using ICA.
Coincidence maps, representing the percentage of single runs within a session for which ICA identified a given voxel as activated, are shown in the figure. To identify activated voxels, run-specific maps were converted to z-scores and thresholded (|z|>2.5). Negative values indicate that the voxel appears with negative intensity.

