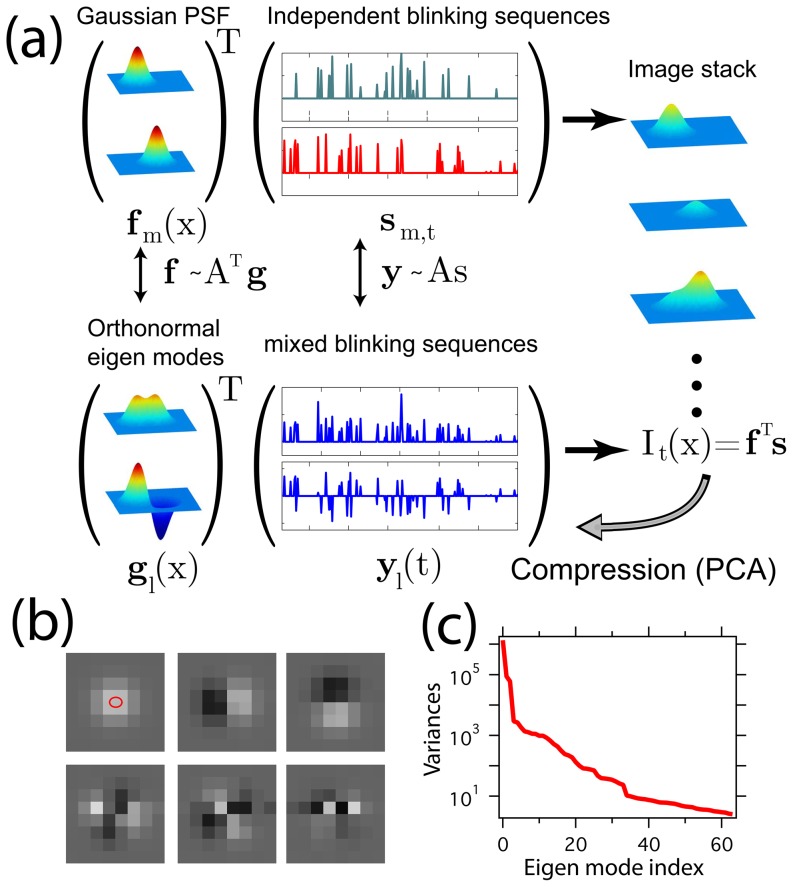
Figure 1. The SCORE technique illustrated using simulated data.
(a) Two emitters produce a Gaussian shaped point spread function  , associated with a temporal blinking sequence
  that is independent one another. The product of the spatial profiles and temporal sequences is the observable images, which can be transformed into a set of orthonormal eigen modes
  and associated mixed and thus correlated fluctuation sequences
  . The distribution of the emitters can be found by measuring the distance between a Gaussian point spread function and the subspace span by the eigen modes that have significant variation above noise. (b) First 6 eigen modes of flickering emitters distributed evenly on a sub-diffraction sized ellipse indicated by the red oval. (c) The sorted variances of all the 64 eigenmodes.

