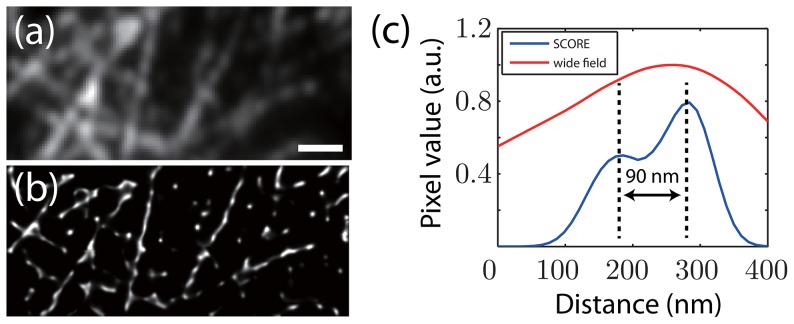
Figure 5. Quantum dot labeled microtubules in HeLa cells were imaged and analyzed with SCORE.
(a) An averaged image of 1000 frames (7.4 seconds) of quantum dot labeled microtubules. (b) SCORE image of the same 1000 frames. STORM is not applicable due to the high density of QDots. (c) Intensity line profile of he labeled portion of the wide field image (indicated by the arrow in (b)) and SCORE image (blue line). The line profiles were obtained from linear interpolation of the original images. Scale bar: 1 µm.

