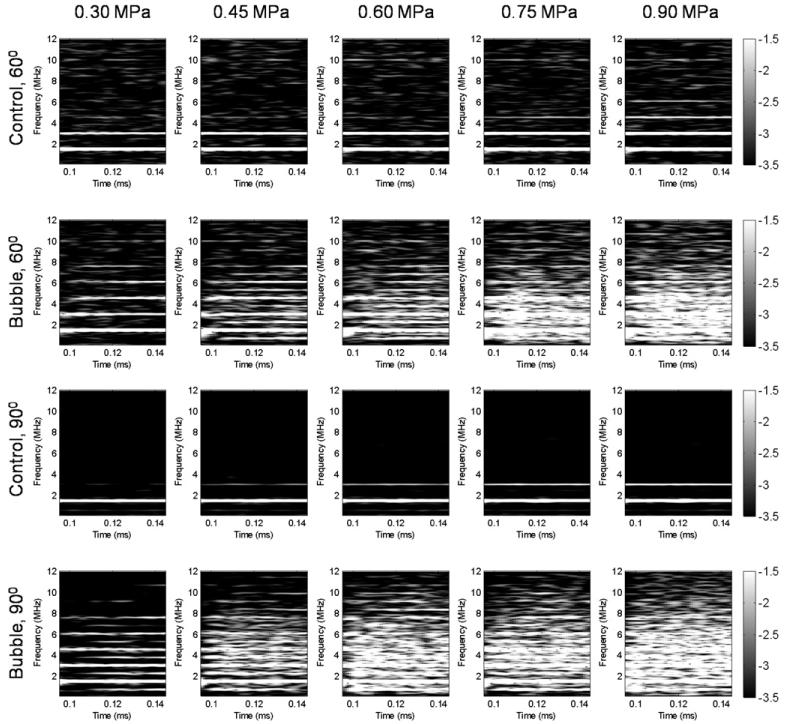
Figure 3.
Spectrogram of the first pulse in the phantom study without and with the microbubbles at five distinct acoustic pressures. Acoustic emissions were acquired with the hydrophone positioned at 60° and 90° from the longitudinal axis of the FUS beam. No broadband acoustic emissions were detected without the microbubbles while, with the microbubbles, the broadband acoustic emissions were detected at pressure equal to or higher than 0.45 MPa. At 0.30 MPa, the ultra-harmonics were detected at the 90° PCD but not at the 60° PCD.

