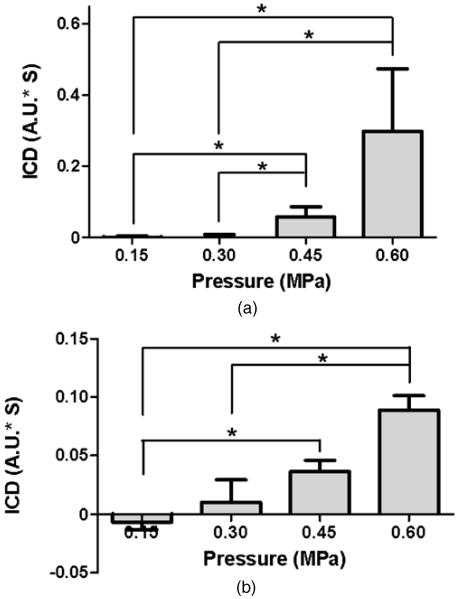
Figure 6.
ICD at four distinct acoustic pressures using (a) transducer-A or (b) transducer-B. ICD was quantified as the area under the VRMS curve from 0.095 ms to 0.145 ms, at each pressure. The signal used for quantification was from a focused hydrophone. For transducer-A, the ICD at 0.45 MPa and 0.60 MPa was significantly higher than at 0.15 MPa and 0.30 MPa (*P < 0.05). For transducer-B, the ICD at 0.60 MPa was significantly higher than at 0.30 MPa and 0.15 MPa. The ICD at 0.45 MPa was also significantly higher than 0.15 MPa (* denotes P < 0.05).

