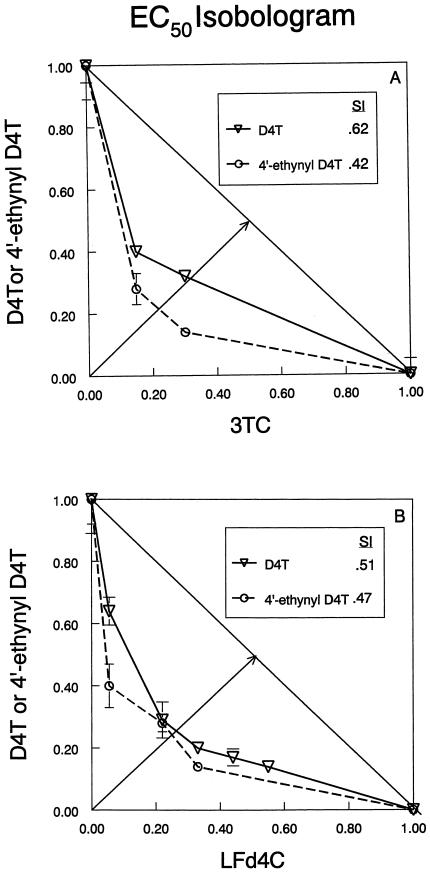
FIG. 4.
Antiviral isobolograms of D4T and 4′-ethynyl D4T in combination with (A) 3TC and (B) LFd4C data obtained with the MT-2/HIV IIIB system. The numbers along each axis represent values proportional to that of the EC50 (assigned a value of 1) for the drug indicated as a single agent. EC50 values for single agents are 1.4 μM (D4T), 0.5 μM (4′-ethynyl D4T), 1.0 μM (3TC), and 0.18 μM (LFd4C). Each datum point represents a combination that produces an effect equivalent to that of the EC50 for either drug alone. SI values were calculated according to the fractional distance from the 45° line to the line (drawn between the 1.00 values on the x and y axes) that indicates that the drug interaction is additive; the total distance was assigned a value of 1.0. The symbols represent the means of three determinations, and the error bars represent the standard deviations of the slope at the concentrations indicated. This isobologram was generated from one of several similar experiments.

