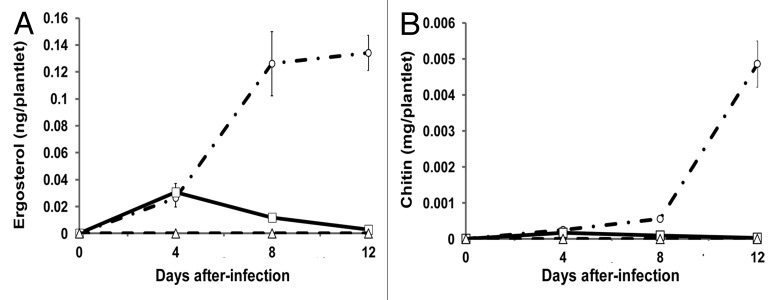
Figure 3. Development of U. maydis within infected A. thaliana plantlets. (A) Ergosterol determination. (B) Chitin determination. Empty circles with dotted lines, plantlets infected with the haploid. Empty squares with solid lines, plantlets infected with the diploid. Empty triangles with dotted lines, control plantlets that received sterile distilled water. Results from three independent experiments with 100 plant batches in each one. Results expressed as ng ergosterol or mg GlcNAC per plantlet. Bars represent standard error values.
