Figure 3.
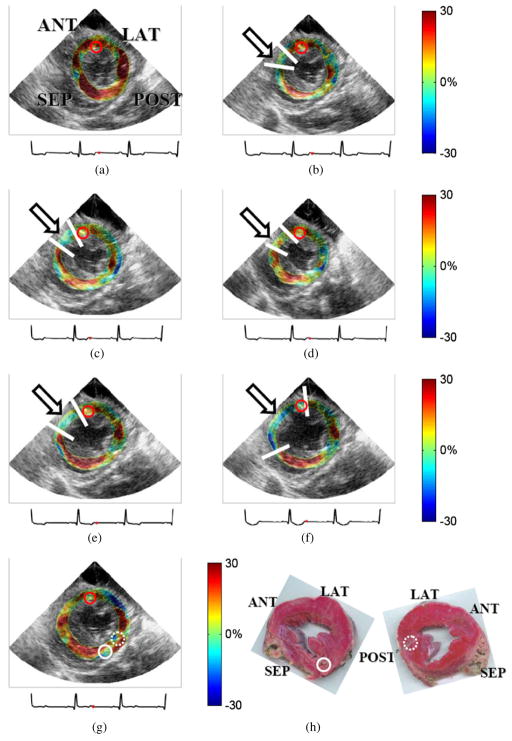
Cumulative systolic radial strain images of the same canine left ventricle as in figure 2 at (a) 0%, (b) 20%, (c) 40%, (d) 60%, (e) 80% and (f) 100% LAD flow reduction levels and (g) after reperfusion. The red dot on the ECG (below each image) indicates the corresponding cardiac phase. The arrows and the white lines on the anterior wall region indicate the ischemic region. Regions are indicated as in figure 1. (h) Both sides of one canine mid-ventricular slice stained using 1% TTC solution with pale (unstained by TTC) and red (stained by TTC) colors indicating infarcted and normal tissues, respectively. The left and right pathology images are the apical and basal sides of the same heart slice, respectively. The pathology image viewed from the apical side was oriented in accordance with the echocardiogram. Solid, dotted and red solid circles indicate the implanted SM crystal locations and transmural recordings.

