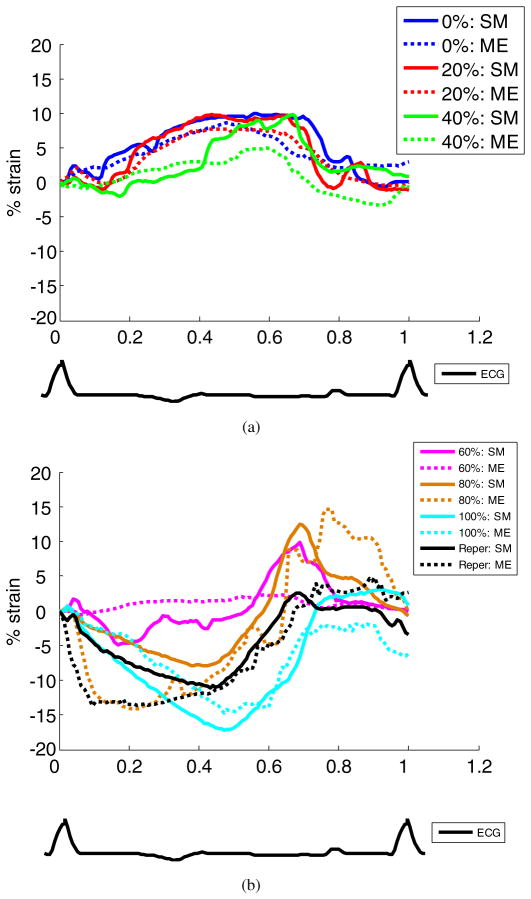
Figure 5.
Temporal radial strain curves of another canine heart in an anterior–lateral wall region of 3 × 3 mm2 at (a) 0%, 20%, 40%, and (b) 60%, 80%, and 100% LAD flow reduction levels and after reperfusion (Reper). Below the figure is shown the ECG at baseline. ME and SM denote myocardial elastography and sonomicrometry, respectively.

