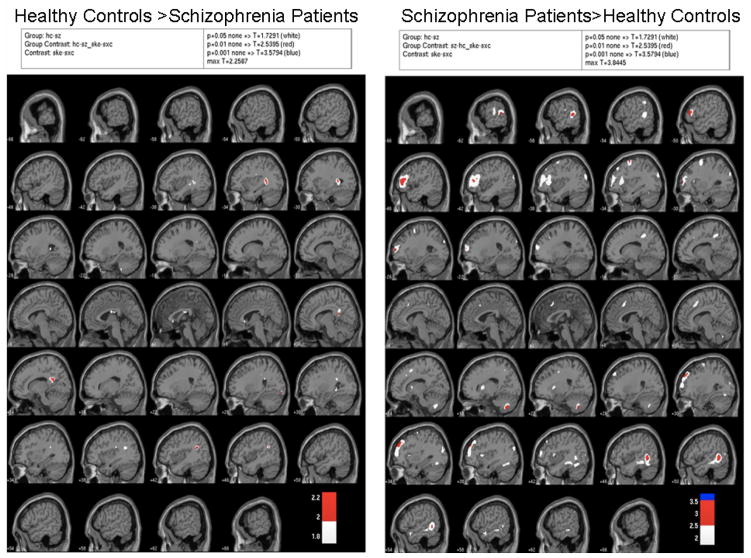
Figure 3.
SPM group contrasts showing areas more active in healthy controls than patients for False Alarms-Hits on the left and areas more active in patients than healthy controls for False Alarms-Hits on the right. White indicates p=.05, red indicates p=.01, and blue indicates p=.001, all uncorrected for multiple comparisons.

