
Figure 3.
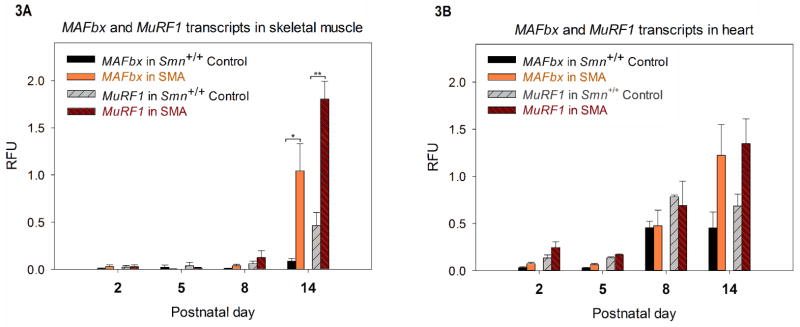
Quantification of MAFbx and MuRF1 transcripts (by ddPCR) at PND01, PND 05, PND08 and PND14 of Smn+/+ Control and SMA animals. (n=3 for each group at each time point) An increase in the mean relative fluorescence units (RFU) for MAFbx and MuRF1 was observed at PND14 in SMA. (A) MAFbx and MuRF1 transcripts in skeletal muscle: MAFbx in Smn+/+ Control and SMA were 0.08±0.02 and 1.04±0.28 respectively at PND14, while for MuRF1 transcripts the mean RFU for Smn+/+ Control was 0.46±0.13 SMA while that for SMA was 1.80±0.18 at PND14. (*P=0.04, **P=0.01) (B) MAFbx and MuRF1 transcripts in heart: For MAFbx, the mean RFU for Smn+/+ Control was 0.45±0.16 v/s 1.22±0.32 for SMA at PND14. For MuRF1, the mean RFU for Smn+/+ Control and SMA were respectively 0.68±0.12 and 1.34±0.26 at PND14. (error bars = SEM)