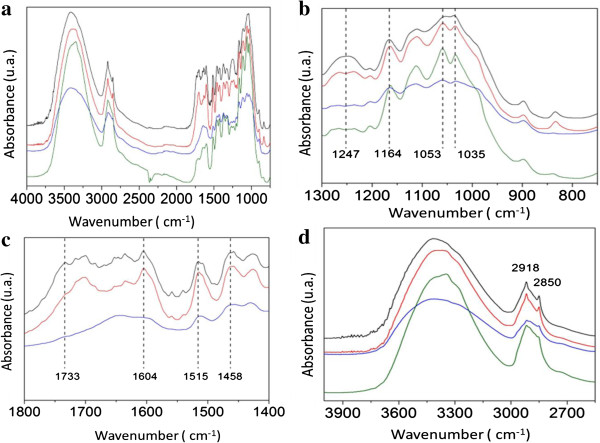
Figure 4.
Fourier transform infrared (FTIR) spectra of sugarcane bagasse (SB). (a) FTIR spectra of the crushed SB in the range of 4,000 to 1,000 cm-1. The black line represents the SB. The red line, blue line, and green line represent the hydrolysis with sulfuric acid (H2SO4), alkaline hydrolysis with sodium hydroxide (NaOH), and enzymatic hydrolysis, respectively. (b) FTIR spectra of the crushed SB in the range of 1,300 to 750 cm-1. The black line represents the SB. The red line, blue line, and green line represent the hydrolysis with sulfuric acid (H2SO4), alkaline hydrolysis with sodium hydroxide (NaOH), and enzymatic hydrolysis, respectively. The vertical dashed line denotes the wave number related to SB, which provides a better comparison. (c) FTIR spectra of the crushed SB in the range of 1,800 to 1,400 cm-1. The black line represents the SB. The red and blue line represent the acid hydrolysis with sulfuric acid (H2SO4) and alkaline hydrolysis with sodium hydroxide (NaOH), respectively. The vertical dashed line denotes the wave number related to SB, which provides a better comparison. (d) FTIR spectra of the SB in the range of 3,900 to 2,700 cm-1. The black line represents the SB. The red line, blue line, and green line are the acid hydrolysis with sulfuric acid (H2SO4), alkaline hydrolysis with sodium hydroxide (NaOH), and enzymatic hydrolysis, respectively. The vertical dashed line denotes the wave number related to SB, which provides a better comparison. FTIR, Fourier transform infrared; SB, sugarcane bagasse.

