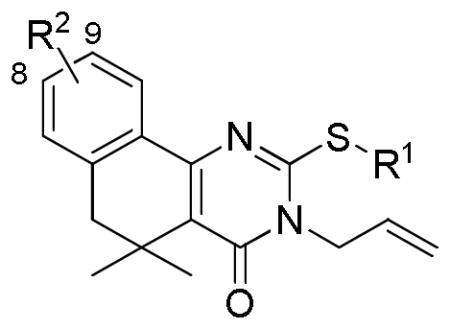
Table 1.
Activity data for tag-free photoprobes 10, 19, and 27.

| |||||
|---|---|---|---|---|---|
| Cmpd | R1 | R2 | T/C (5 μM)a | Growth T/C (50 μM)b | IC50 (μM)c |
| 10a | propargyl | 8-Bz | 0.77 ± 0.34 | 1.09 ± 0.04 | nd |
| 10b |
|
8-Bz | 0.51 ± 0.07 | 0.94 ± 0.18 | 3.8 ± 0.6 |
| 19a | propargyl |

|
1.07 ± 0.16 | 0.96 ± 0.09 | nd |
| 19b |
|

|
0.49 ± 0.34 | 1.07 ± 0.02 | 0.33 ± 0.70 |
| 19c |

|
|
0.71 ± 0.40 | 1.01 ± 0.09 | nd |
| 19d |

|
8-O-propargyl | 0.89 ± 0.16 | 1.02 ± 0.01 | nd |
| 27 |
|
9-N3 | 0.30 ± 0.08 | 0.98 ± 0.04 | 0.19 ± 0.26 |
| 4 | Et | 9-OMe | 0.10 ± 0.06 | 0.73 ± 0.07 | 1.3 ± 0.6 |
Amount of SK activity in GAS culture measured via colorimetric assay (A405) after incubation with 5 μM test compound for 24 hours divided by SK activity measured in GAS culture 24 hours after treatment with DMSO control, +/− standard deviation.
Growth inhibition as measured by OD600 of GAS culture 24 hours after treatment with 50 μM test compound divided by OD600 of control GAS culture treated with DMSO control after 24 hours, +/− standard deviation.
Concentration at which 50% maximal inhibitory effect against SK expression was achieved +/− standard deviation. Each data point is derived from the statistical treatment of at least 3 replicates. nd = not determined.
