
Figure 3. Destruction of the larval salivary glands is delayed in ino80psg25 mutant animals.
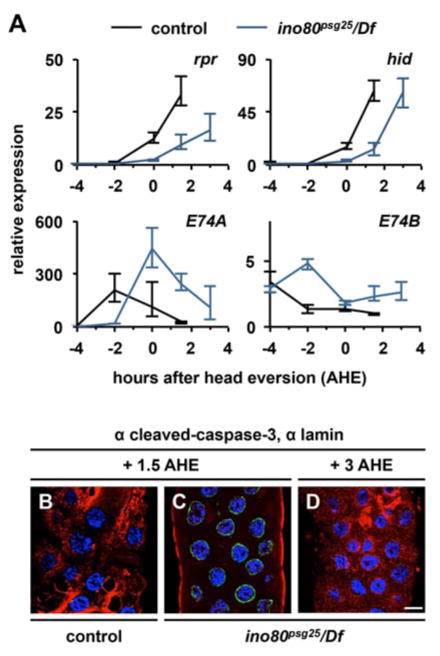
(A) qPCR analysis of target gene expression in control (black lines) and ino80psg25 (blue lines) mutant salivary glands staged relative to head eversion. Control glands have strong induction of rpr and hid by 1.5 h after head eversion (AHE), while ino80psg25 glands do not have maximal induction of rpr and hid until 3 AHE. Induction and regression of E74A and E74B is also delayed in ino80psg25 mutant salivary glands. y-axis represents relative expression compared to the lowest point in control animals; x-axis represents developmental stage relative to head eversion. Three independently-isolated samples were run for each timepoint; relative expression calculated by normalizing to rp49. (B-D) Activation of caspases detected by staining for cleaved-caspase-3 (red) and nuclear lamin (green) in control and ino80psg25 mutant salivary glands. DNA labeled with DAPI shown in blue. Control glands have ubiquitous caspase activation and strong loss of nuclear lamin staining by 1.5 AHE (B). In contrast, ino80psg25 glands have caspase activation similar to controls by 3AHE (D), but not at 1.5 AHE (C). Scale bar is 20μm. AHE= after head eversion.