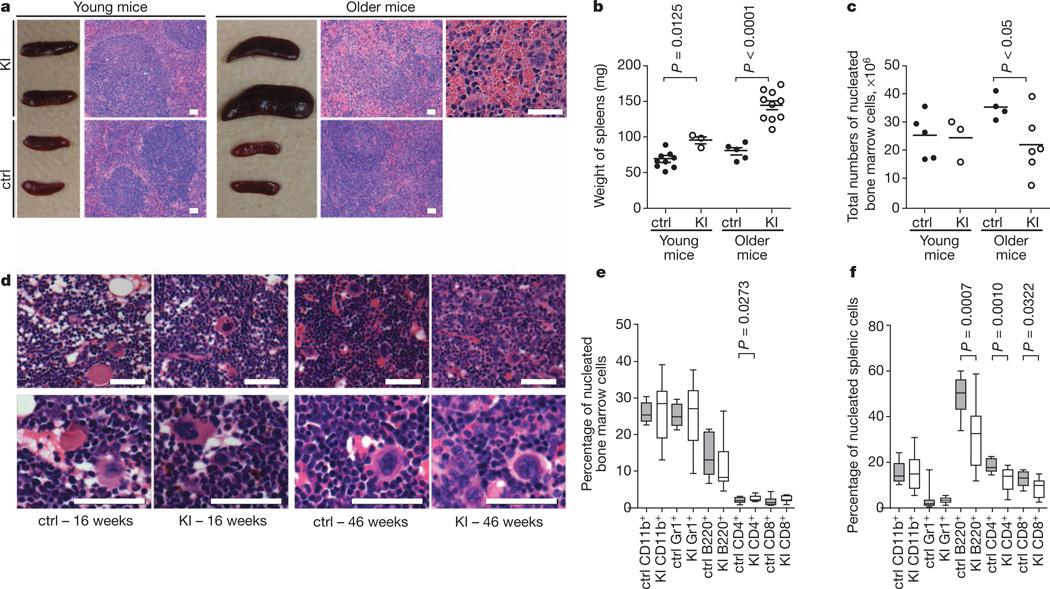
Figure 1. LysM-KI mice show age-dependent splenomegaly and decreased bone marrow cellularity.
a, Macroscopic appearance and haematoxylin-and-eosin-stained sections of spleens from young and older control (ctrl) and LysM-KI (KI) mice. b, c, Spleen weights (b) and total numbers of nucleated BM cells (c) from young and older control and LysM-KI mice (n = 3–5 per group). Horizontal line, mean. d, Representative haematoxylin-and-eosin-stained sections of BM from femurs of young and older control and LysM-KI mice (n = 4 per group). e, f, Quantifications of flow cytometric analyses of mature haematopoietic cell populations among total nucleated BM (e) and splenic cells (f) from older control and LysM-KI (n = 10–14 per group) mice. P values were determined using the unpaired t-test with Welch’s correction. Scale bars, 50 µm.

