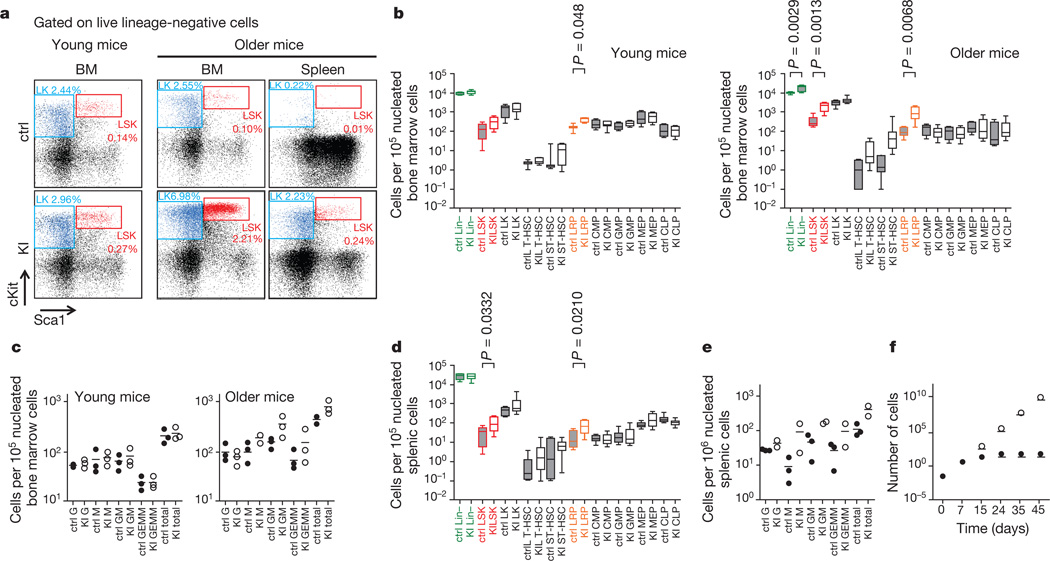
Figure 2. LysM-KI mice showage-dependent increases in lineage-restricted progenitors and extramedullary haematopoiesis.
a, Flow cytometric analysis of live lineage-negative cells for cKit and Sca1 in cells from the BM of young (left), and from the BM and spleen of older control and LysM-KI mice (right). LSK (red) and LK (blue) populations are highlighted. The percentage of a given population among total viable BM cells is indicated. b, Quantification of flow cytometric analyses for the indicated HSC and HPC populations in BM of young (n = 3–14 per group) and older (n = 4–8 per group) control and LysM-KI mice. Horizontal line, median; box, median±25%; end of bars, minimum and maximum. c, CFC assays of BM cells from young and older control and LysM-KI mice (n = 3 per group). Data points are the mean number of colonies of the indicated lineage for individual mice. Horizontal line, mean of values for all three mice in a group. d, Quantification of flow cytometric analyses for the indicated HSC and HPC populations in the spleens of older (n = 7–8 per group) control and LysM-KI mice, determined as for b. e, CFC assays of nucleated splenic cells from older control (n = 3) and LysM-KI (n = 2) mice determined as for c. f, Serial replating in methylcellulose of BM cells from control and LysM-KI mice (n = 2 per group; control, filled circles; LysM-KI, empty circles). Data are the mean total cell number for both mice in a group (in units of 106).

