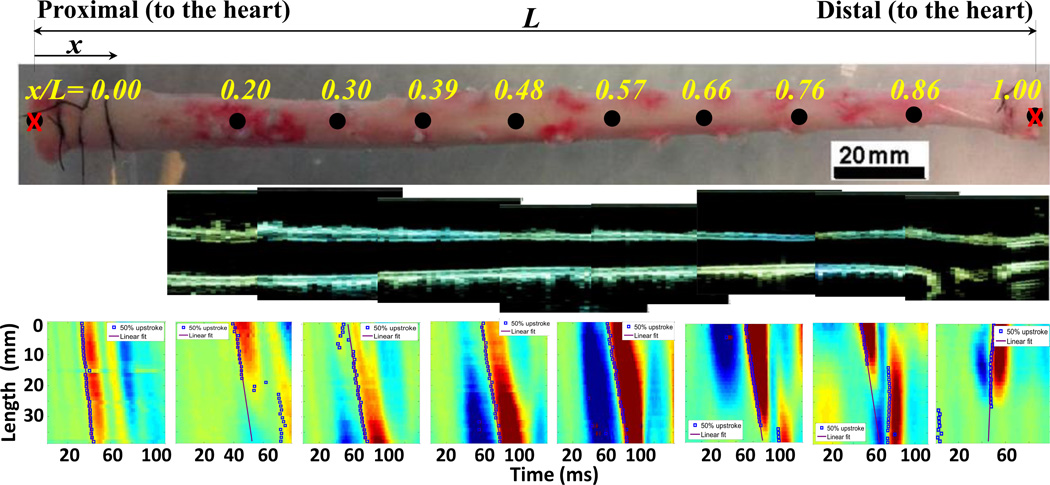
Figure 3.
(Row 1): An illustration of the aortic trunk between the proximal (x/L=0) and distal (x/L=1) locations and eight selected points along the aorta. (Row 2): The B-mode images at each of the same aorta trunk indicating the top and bottom walls. (Row 3): The wall displacement spatio-temporal plots at each of the above locations, obtained by the PWI.

