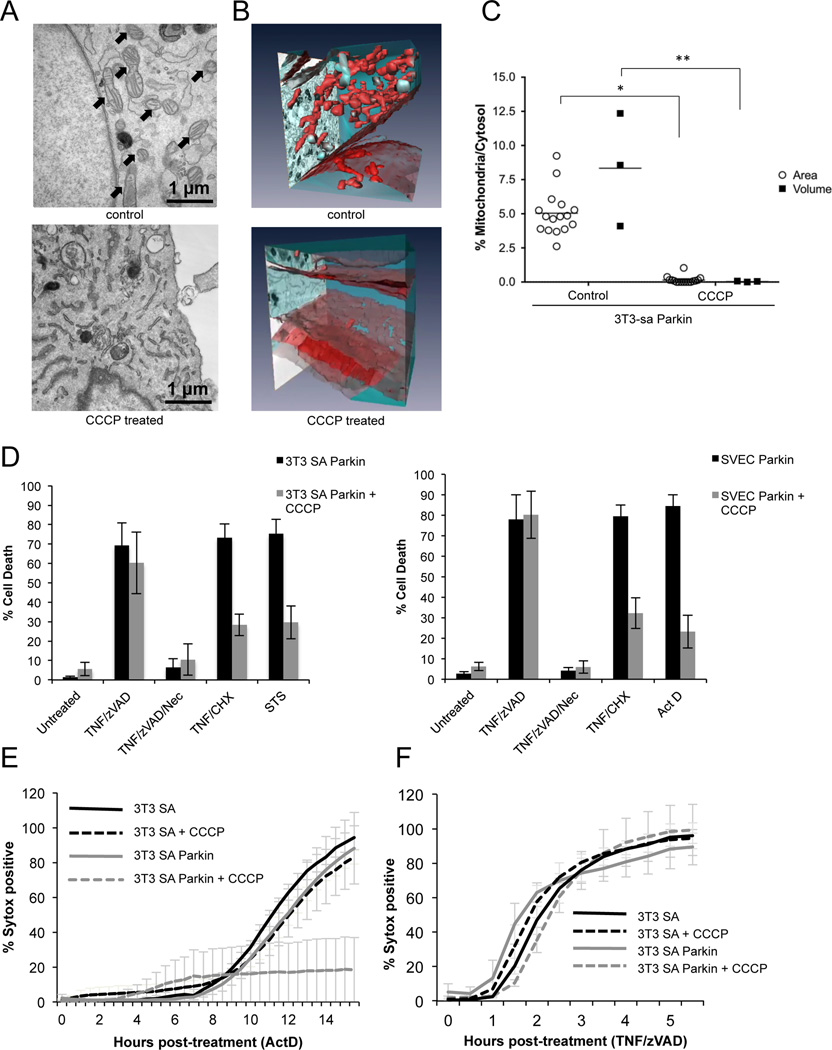
Figure 2. TNF dependent necroptosis does not require mitochondria.
A. Representative TEM images of control or CCCP treated 3T3-SA Parkin expressing cells, arrows denote mitochondria. B Representative 3D-EM images of control or CCCP treated 3T3-SA Parkin expressing cells. Mitochondria are colored red and cytosol is colored blue. B. 3D-EM quantification of mitochondrial mass of Parkin expressing 3T3-SA treated with CCCP for 48 hours. Black squares represent the ratio of “Area Mitochondria/Area Cytosol” and expressed as percentages (%Area Mitochondria/Area Cytosol); white circles represent the percentage of the ratio “Volume Mitochondria/Volume Cytosol”. For further information see Materials and Methods. *, P<0.0001, **, P<0.05. C. Control or Parkin expressing 3T3-SA or SVEC cells were treated with CCCP for 48 hours then treated with the indicated stimuli for 8 hours (TNF/zVAD, TNF/CHX) or overnight with staurosporine (STS) or actinomycin D (ActD). Cell death was determined by propidium iodide (PI) positivity and flow cytometry. D. Mitochondria depletion was triggered in 3T3-SA cells by CCCP treatment for 48 hours, and cells were treated with ActD as indicated. Cell death was assayed using Sytox Green uptake over time in an IncuCyte imager. E. Mitochondria depletion was triggered in 3T3-SA cells by CCCP treatment for 48 hours, and cells were treated with TNF/zVAD as indicated. Cell death was assayed using Sytox Green uptake over time in an IncuCyte imager. Sytox positive cell counts were normalized to total cell numbers using the cell-permeable dye Syto24. Error bars represent the S.D. from the mean of 3 independent experiments. See also Movies S2 and S3.

