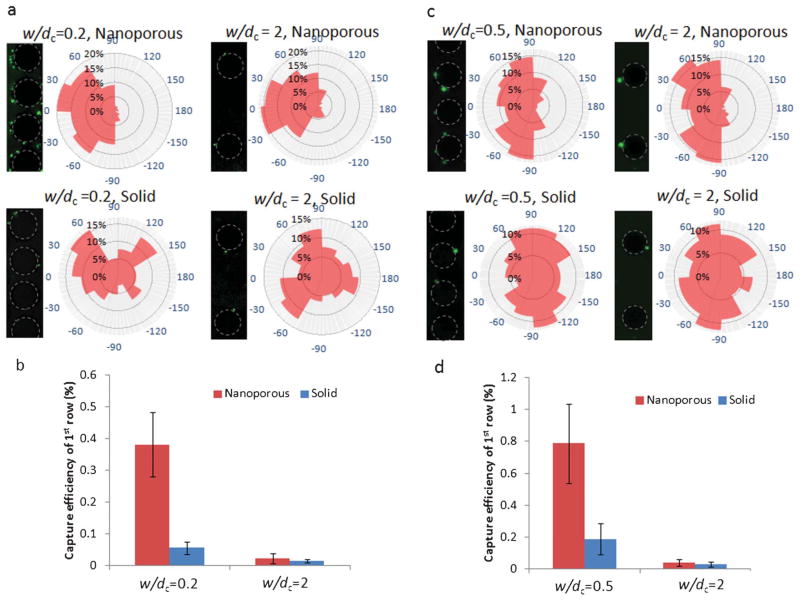
Fig. 5.
Capture of E. coli and PC3 cancer cells on post arrays at different spacings; (a) fluorescent images and angular capture locations of E. coli cells on nanoporous and solid post arrays with 20 and 200 μm gap. Post outlines are traced in dotted lines. Flow direction from left to right. Angular capture locations are plotted as percentage of cells captured in 30° segments; (b) capture efficiency of the first row of each array of nanoporous and solid posts; (c) fluorescent images and angular capture locations of PC3 cancer cells on nanoporous and solid post arrays with 50 and 200 μm gap. Post outlines are traced in dotted lines. Flow direction from left to right. Angular capture locations are plotted as percentage of cells captured in 30° segments; (d) capture efficiency of the first row of each array of nanoporous and solid posts.

