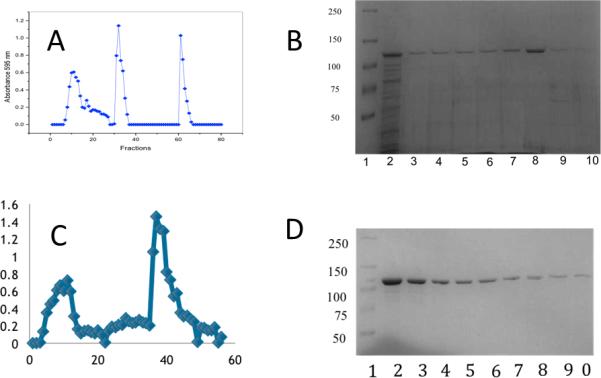
Figure 1.

Results of anion exchange chromotography using Q-Sepharose are depicted in A. (B) SDS-PAGE of the fractions of the flow through containing Pet is shown (Well 1, molecular mass of protein standards in kDa, wells 2-10, fractions collected from the second peak in the chromatogram.) (C) the chromatographic profile for the pet purification of Pet by cation exchange chromatography (Mono S). (D) Corresponding SDS-PAGE of the second peak in C, well 1, molecular mass of protein standards (kDa), wells 2-10, fractions (second peak).
