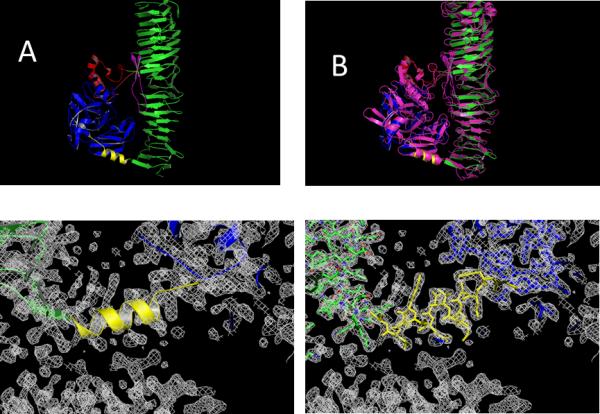
Figure 3.

Comparison between the Pet structure, determined in this work (top left side A) with the closest related structure in the pdb (3SZE) of the EspP protein in purple (on the top right side B). The electron density map depicted on the bottom shows the connecting α-helix (yellow) between the serine protease (blue) and the β-Helical subdomain on the C-terminus (green). The model is represented in cartoon style. On the bottom right the same electron density is shown with the protein represented as a stick model. The contour level is at 1.5 σ for the 2Fo-Fc electron density maps.
