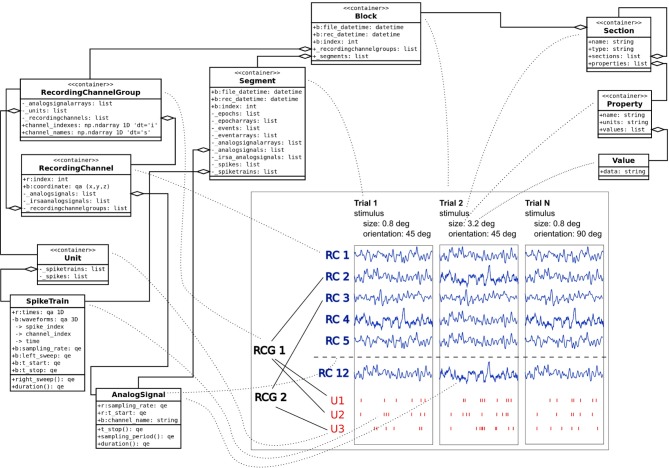
Figure 2.
Example data and metadata structure of an experiment with stimulation changing across trials. The panel on the bottom right represents the recorded signals in a study that investigates receptive fields of neurons in visual cortex of macaque monkeys. Each trial had its unique stimulus configuration (orientation, size, etc.). Local Field Potentials from different channels (RC1–RC12) were recorded during the experiment; spike trains of single units (U1–U3) were obtained by spike sorting. The dotted lines are used to represent a mapping between experimental entities and their representations in the object model. Neo objects13 (left) are used to represent the data part of the experiment. odML14 Section, Property and Value objects (top right) describe stimulus metadata, changing from trial to trial within a given experiment.

