Figure 4.

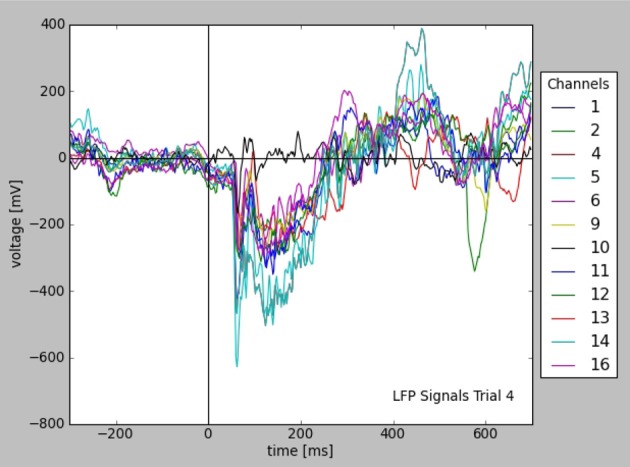
Plot of LFP responses from a trial selected using certain time and stimulus conditions (see text). Note that all informations used for axes, labels, and legend were taken from the stored data and metadata directly.

Plot of LFP responses from a trial selected using certain time and stimulus conditions (see text). Note that all informations used for axes, labels, and legend were taken from the stored data and metadata directly.