
Figure 12.
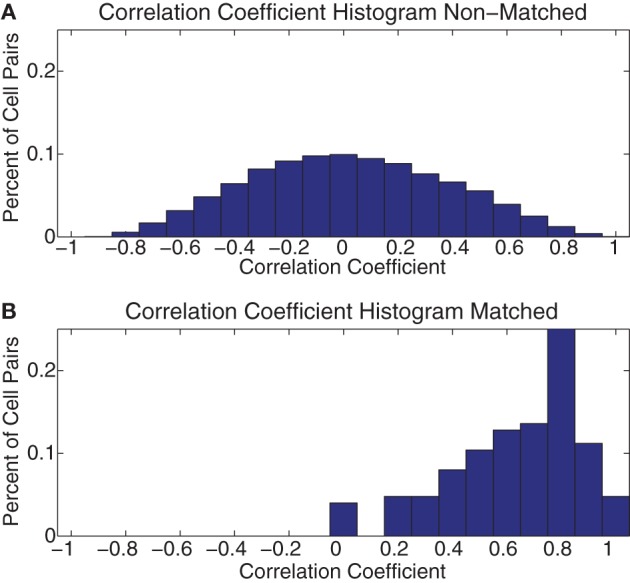
Histogram of across-day correlations. (A) Histogram of the correlation coefficient of all pairs of the 7 × 7 grids of FR seen in Figure 11 for all pairs of cells not identified as being the same cell recorded across multiple days (Non–Matched). (B) The same histogram as in part (A) but for all pairs identified as being the same cell on consecutive days (Matched).