
Figure 8.
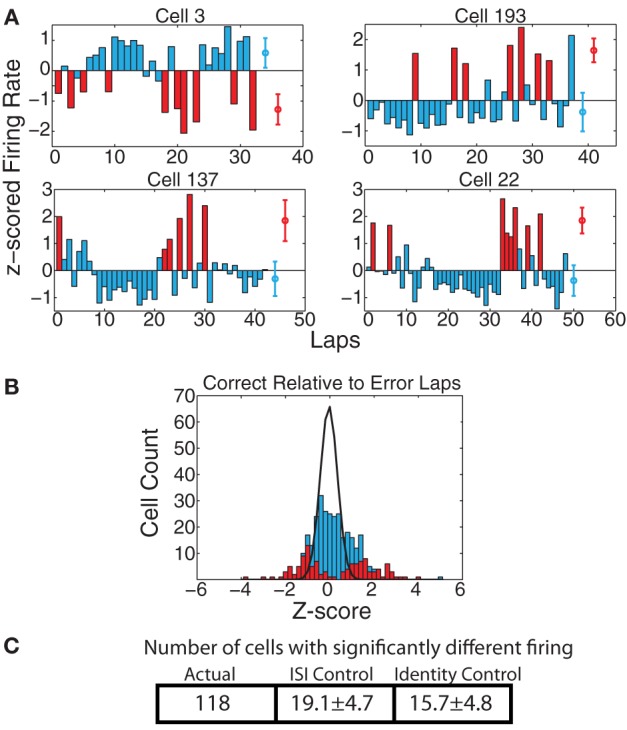
(A) Examples of cells with strong changes in firing rate on correct laps vs. laps on which the animal made an error. Red bars indicate error laps, blue bars correct laps. Red and blue circles represent average firing rates over both types of laps. (B) zerror(correct) comparison. Because there were too few error laps, we only calculated zerror(correct). Bars indicate overall distribution, with red bars indicating cells found to have a significant firing difference by KS test. Black line indicates expected distribution from ID shuffle. (C) Number of cells with significantly different firing (by KS test of the distribution of firing rates on correct laps compared to error laps) relative to expected number of cells from two control conditions with inter-spike-intervals (ISI) or lap identity (ID) randomly shuffled.