Figure 6.
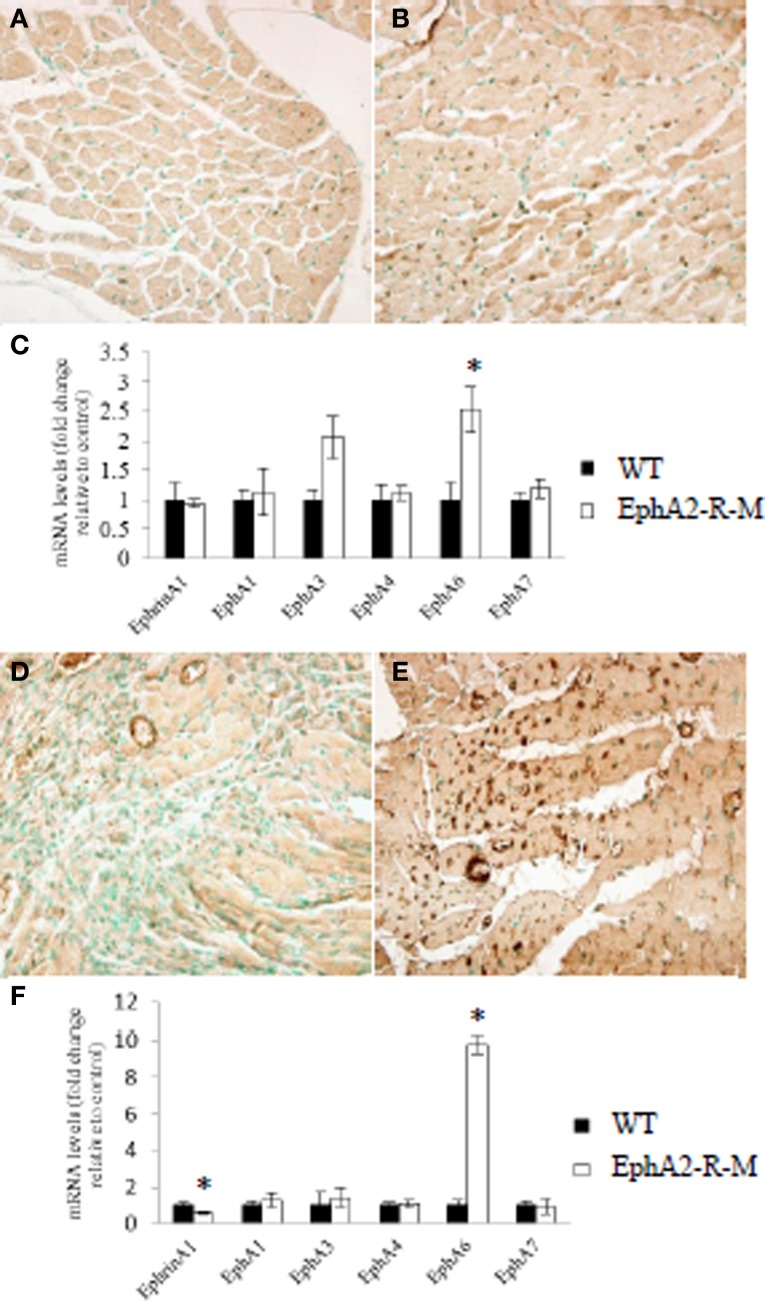
EphA6-R Staining and EphA-R Gene Expression Profiles in WT and EphA2-R-M Hearts at Baseline and 4 Days Post-MI. Representative immunohistochemical staining at 40x of EphA6-R in WT (A) and EphA2-R-M (B) baseline hearts and 4 days post-MI (WT: D; EphA2-R-M: E). EphrinA1 ligand and EphA-R gene expression in WT and EphA2-R-M hearts was performed in hearts at baseline (C) and 4 days post-MI (F). In baseline hearts, EphA6-R gene expression was 2.5-fold greater in EphA2-R-M hearts (*p < 0.05) (C). EphrinA1 ligand expression was decreased 42% (*p < 0.01) and EphA6-R expression was increased 9.8-fold in EphA2-R-M hearts (*p < 0.01) (F).

