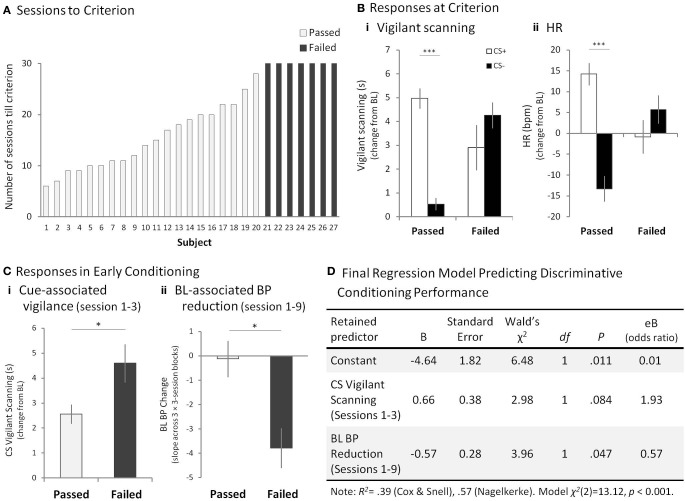
Figure 3.
Mild Aversive Pavlovian Discriminative Conditioning. (A) The number of sessions that each subject in the “passed” (open bar) group (1–20) took to reach the criterion of significantly higher vigilant scanning and HR to the CS+ compared to the CS−, across a series of three consecutive sessions. The “failed” (filled bar) group (subjects 21–27) had still failed to reach criterion by the 30th session. (B) Responses to the CS+ and CS−, compared to BL in the three discrimination criterion sessions for the “passed” group and sessions 28–30 for the “failed group” for (Bi) mean vigilant scanning scores, and (Bii) mean HR. Error bars show standard error of the mean (SEM). (C) “Passed” and “failed” group comparison of (Ci) mean cue-associated vigilant scanning scores during sessions 1–3 and, (Cii) mean BL-associated hypotension measures during sessions 1–9. Error bars show SEM. (D) Of the three variables inserted into the logistic regression analysis, the cue-associated vigilance and BL-associated hypotension were retained in the final model as predictors of passing or failing the aversive discrimination. The positive coefficients for the CS vigilant behavior in sessions 1–3 indicated that as the vigilant behavior score increased by one unit, the odds of failing the discrimination increased from 1.0 to 1.93. On the other hand, the negative coefficient β indicated that as the BL BP measure declined by one unit, the odds of passing the discrimination decreased from 1.0 to 0.57. Thus, the greater BL BP decline, the more likely the animal was to fail the discrimination. *p < 0.05 for “passed” vs. “failed,” ***p < 0.001 for CS+ vs. CS−.

