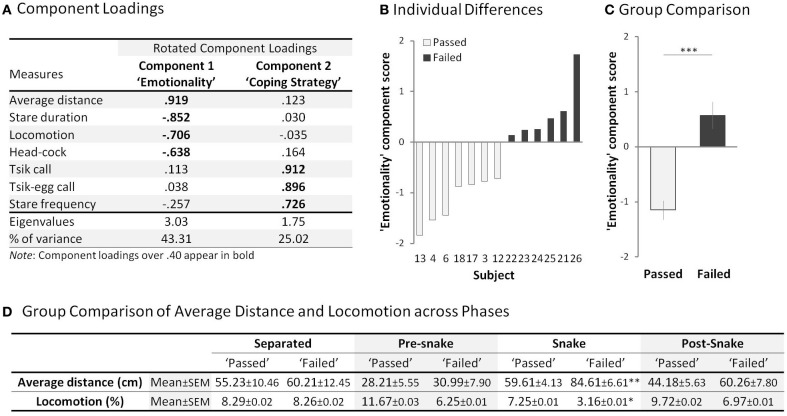
Figure 4.
Rubber Snake Test. (A) Component loadings of the measures in the rubber snake test (n = 44). (B) “Emotionality” (principle component 1) score of each subject in the “passed” (open bar) and “failed” (filled bar) groups. Subject numbers correspond to the numbers in Figure 3A. (C) Comparison of mean “Emotionality” component scores between the “passed” and “failed” groups. Error bars show s.e.m. (D) Mean average distance and locomotion measures of the “passed” and “failed” groups across the four phases. *p < 0.05, **p < 0.01, ***p < 0.001 for “passed” vs. “failed.”

