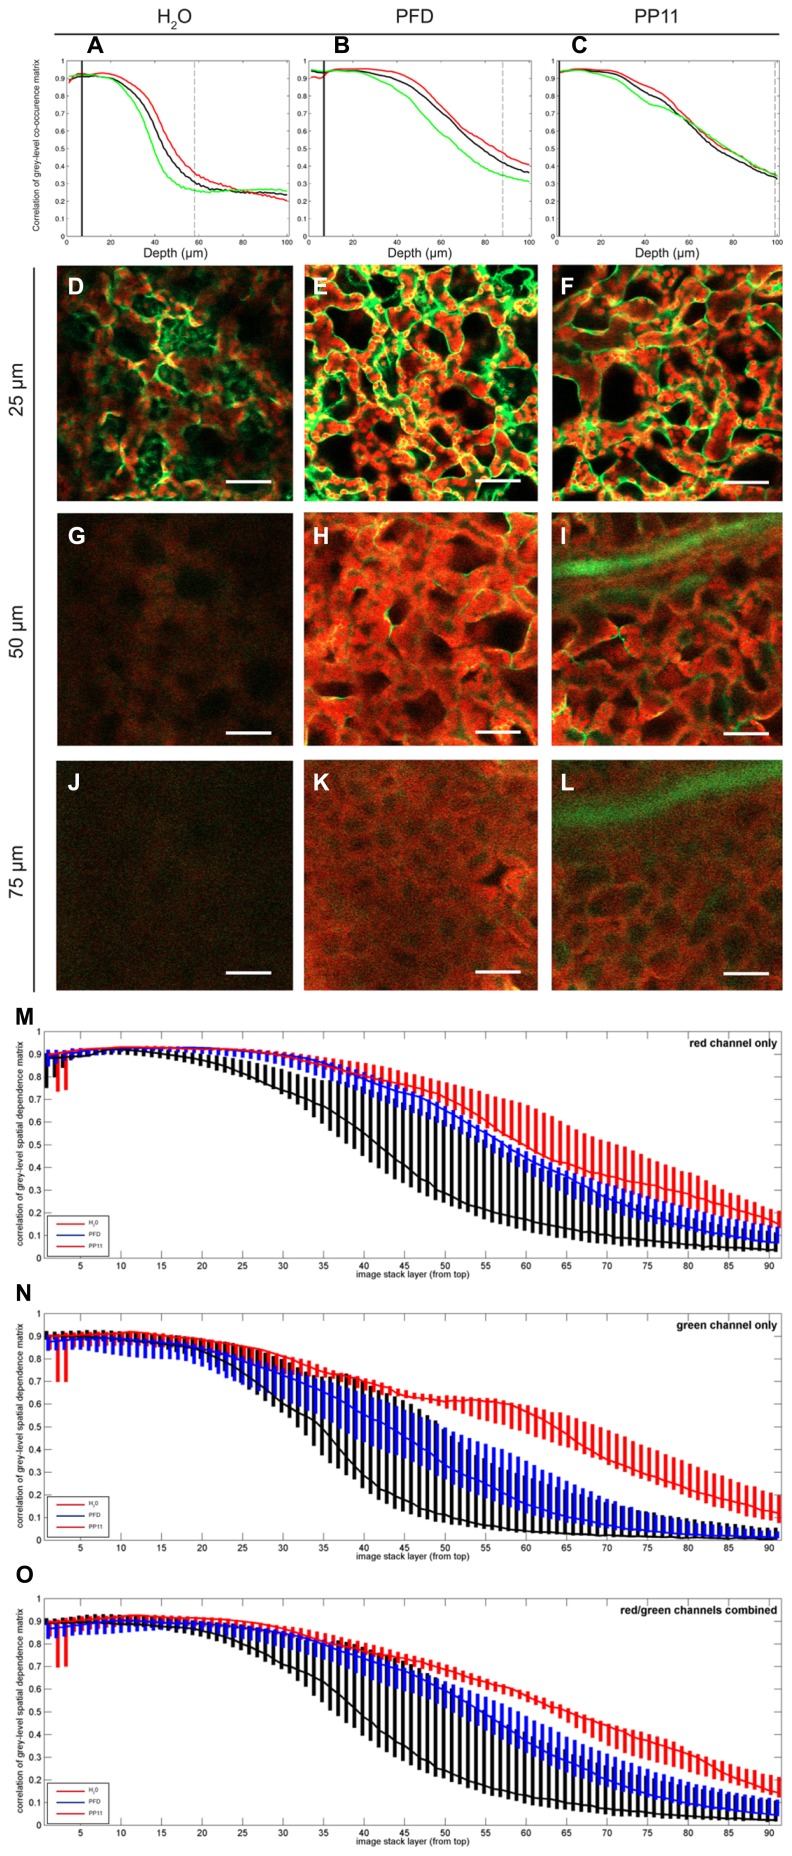
FIGURE 3.
Quantification of image deterioration with depth. (A–C) typical autocorrelation results for single samples mounted in H2O, PFD, and PP11 respectively and imaged as z-stacks 100 μm deep. (D–F) representative images taken at a depth of 25 μm from samples mounted in H2O, PFD, and PP11 respectively (G–I) representative images taken at a depth of 50 μm from samples mounted in H2O, PFD, and PP11 respectively. Signal was collected from 518 to 604 nm for Venus, and is displayed in green and at 647–690 nm for chlorophyll, shown in red. (J–L) representative images taken at a depth of 75 μm from samples mounted in H2O, PFD, and PP11 respectively. (M–O) range and median plotted for all samples (n=5) mounted in H2O, PFD, or PP11 for red, green, and total signal respectively. Scale bars are 50 μm.

