Figure 2.

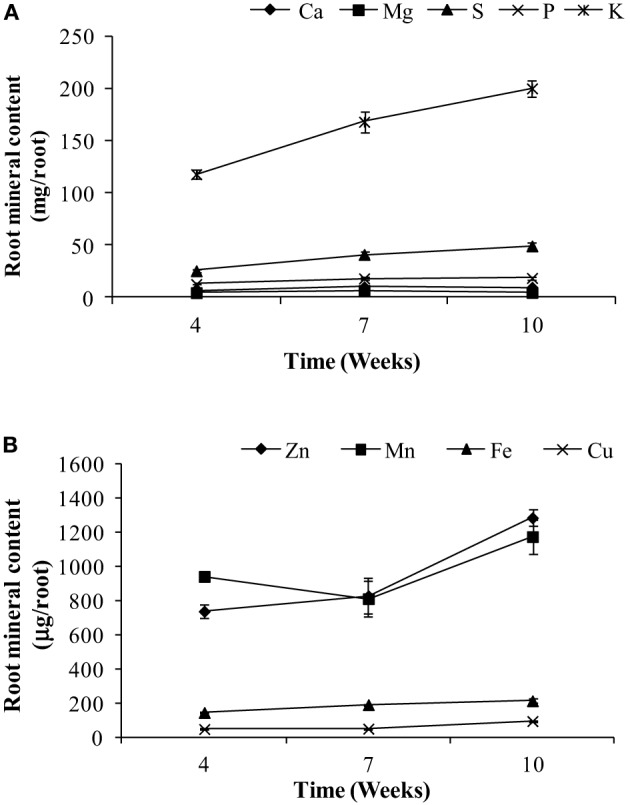
Root content of (A) macronutrients and (B) micronutrients for weeks 4, 7, and 10 in pea. Values ± SE (n varies from 3 to 6). Some error bars do not extend beyond the symbols.

Root content of (A) macronutrients and (B) micronutrients for weeks 4, 7, and 10 in pea. Values ± SE (n varies from 3 to 6). Some error bars do not extend beyond the symbols.