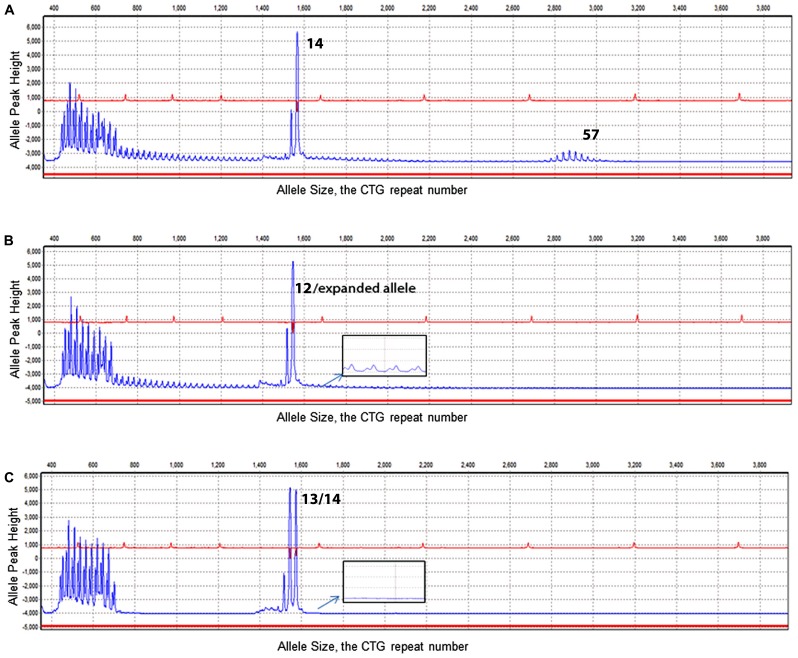
FIGURE 2.
Electropherogram results of TP-PCR. X-axis illustrates the CTG repeat number. Y-axis illustrates the allele peak height. (A) Electropherogram of DM1 genotyping of a sample showing alleles of 14/57 CTG repeats. (B) Electropherogram result of a sample with a normal allele was determined with a size of 12 CTG repeats. In addition to the normal allele, a ladder signal was represented by TP-PCR indicating the existence of an expanded allele (see enlarged insert). (C) Demonstrates two normal heterozygous alleles (13/14) and no laddering signal from the TP-PCR (see enlarged insert).

