
Figure 5.
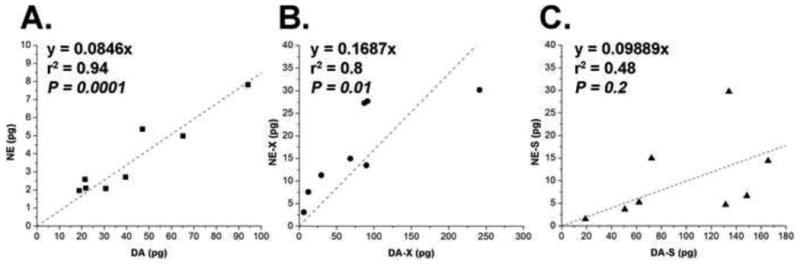
(A) Correlations between the quantities of dopamine (DA) and norepinephrine (NE), (B) between conjugated dopamine (DA-X) and conjugated norepinephrine (NE-X), and (C) between dopamine sulphate (DA-S) and norepinephrine sulphate (NE-S). Plotted values refer to the mean quantities from samples at one-day intervals (pg/tick) of three biological replicates. The linear regression fitting and the significances of the correlation are shown.