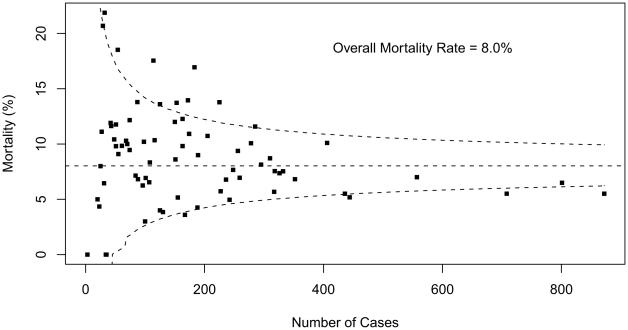
Fig 4.
Mortality data displayed as a funnel plot for STAT Category 4 operations. The horizontal dashed line depicts aggregate STS mortality before discharge. Dashed lines depicting exact 95% binomial prediction limits were overlaid to make a funnel plot. Squares represent the number of cases and mortality before discharge for individual STS Congenital Heart Surgery Database participants (centers). (STAT = The Society of Thoracic Surgeons [STS]-European Association for CardioThoracic Surgery [EACTS] Congenital Heart Surgery Mortality Categories.)

