
Fig. 1.
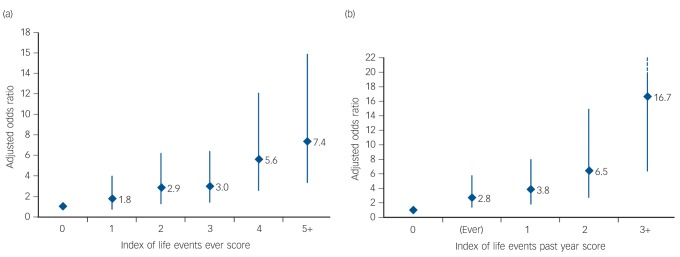
Adjusted odds ratios (ORs) with 95% confidence intervals for any psychotic experience(s) by indices of life events: (a) ever, (b) in past year.
Odds ratio adjusted for age, gender, ethnicity, education, social class and cannabis use. Presence of each event scores 1 and these are summed to create a simple index of exposure to the listed life events: in (a) for ‘ever’, with a range from 0 to 9, the numbers scoring 5 and above were relatively small and so were combined in the final category of 5+; in (b) for ‘past year’, with a range from 0 to 5, the numbers scoring 3 and above were relatively small and so were combined in the final category of 3+. When the linear effect of the index was modelled, there was strong evidence of linear effect: (a) adjusted OR = 1.45, 95% CI 1.32-1.59, indicating an average increase in odds of psychotic experiences of 1.45 for every unit increase in number of life events; (b) adjusted OR = 1.70 (95% CI 1.44-2.00), indicating an average increase in odds of psychotic experiences of 1.70 for every unit increase in number of life events.