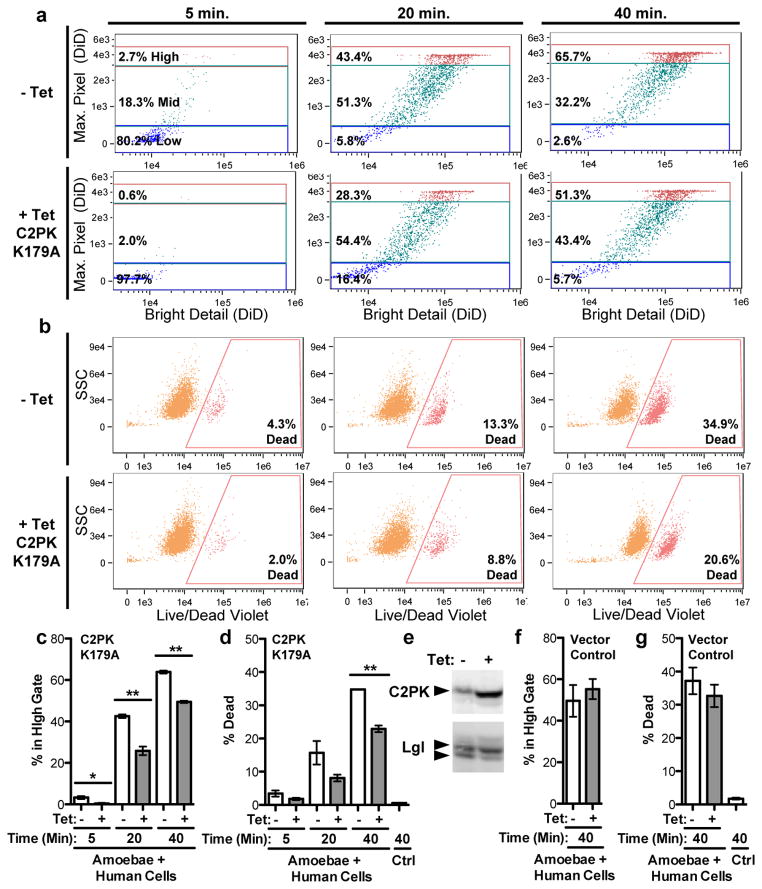
Figure 3. Amoebic trogocytosis contributes to human cell killing.
a – d, Imaging flow cytometry analysis with amoebae expressing a tetracycline (tet)-inducible copy of EhC2PK K179A. a, Measurement of fragmentation. b, Detection of dead cells. c – d, Means and standard deviations for biological duplicates at each time point (10,000 events/each). e, Western blot demonstrating EhC2PK over-expression in tet-induced cells; Lgl, loading control. Blots are representative of three independent experiments. f – g, Imaging flow cytometry analysis with vector control amoebae; shown are means and standard deviations for biological duplicates (10,000 events/each). P-values from t-tests: * < .05, ** < .01, *** < .001.

