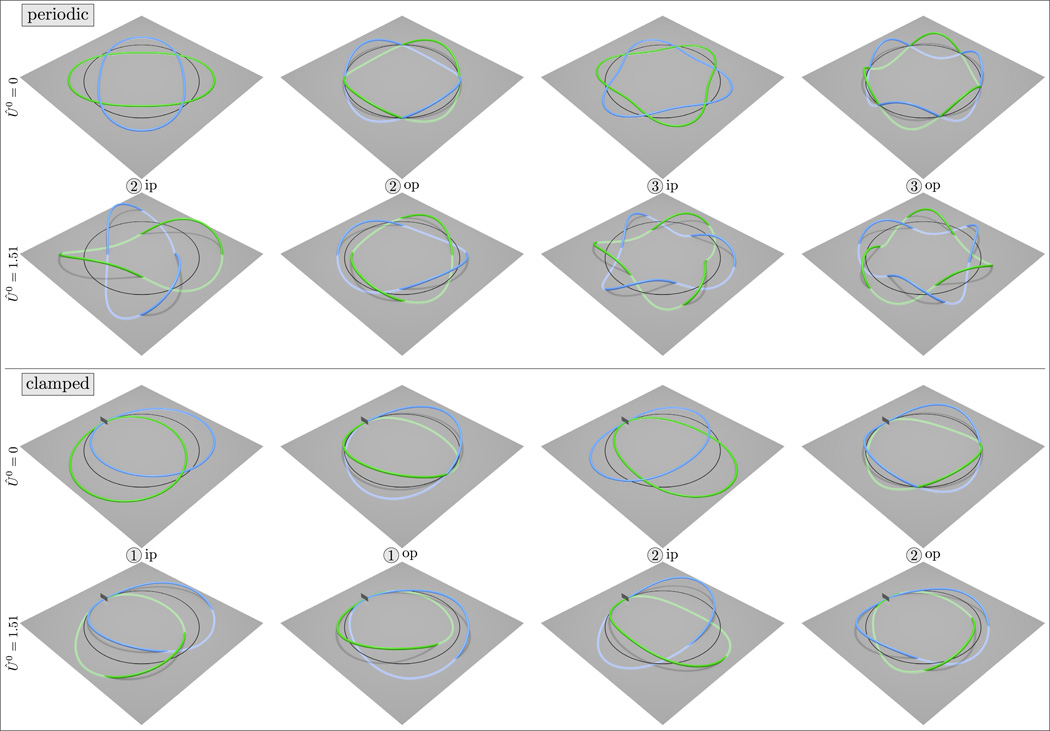
Fig. 4.
Three-dimensional shapes of flexural modes for periodic (top) and clamped (bottom) boundary conditions with Û0 = 0 and Û0 = 1.51 (both cases with η = 0). For each type of boundary condition we represent extremum shapes (i.e., the maximum and minimum of the oscillation) of the first four modes in blue and green. The gray plane denotes the horizontal plane and the dark line on the plane denotes the geometry of the equilibrium solution. The mode indices and types are given by the numbers in the light gray circles and by the labels ”ip” and ”op”. For clamped boundary conditions the small dark gray rectangle represents the support. The light blue and green colors denote the parts of the rod below the horizontal plane. Finally, the radius of the rod and the amplitudes of the displacements have been chosen to allow a clear representation of each mode.

