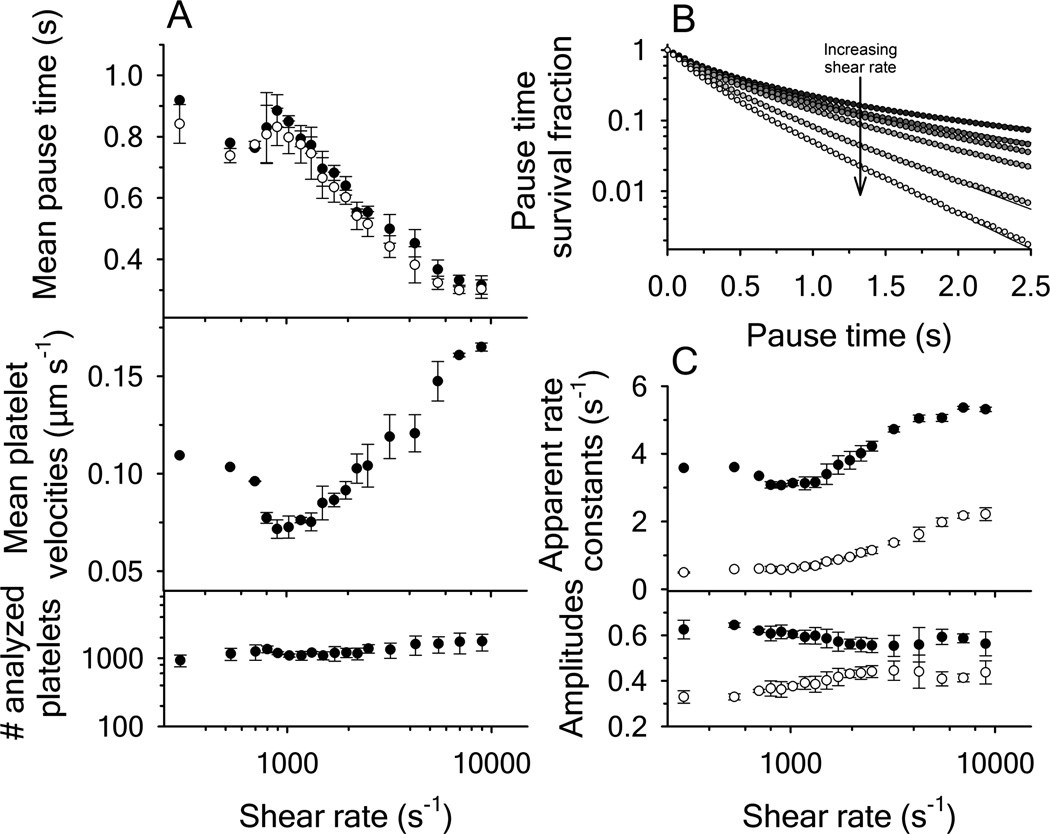
Figure 1.
Platelet translocation on disulfide-intact A1 domain as a function of shear rate. (A, upper panel) Mean pause times derived from the statistical average of platelet distributions (filled circles) and from biexponential fitting of the pause time survival fraction using equation (1) (open circles), mean platelet velocities (center panel) and the amount of platelets analyzed (lower panel). (B) Survival fraction decay functions of the platelet pause times with increasing shear rates. Rates are: 800, 1320, 1500, 1950, 2500, 4250 and 9000 s−1 from top to bottom. Curves were fit to a biexponential functions. (C) Apparent rate constants k1 (black circles) and k2 (open circles) and the fractional amplitudes associated with k1 (black circles) and k2 (open circles). Error bars represent the mean standard deviation from four independent experiments.

