Figure.
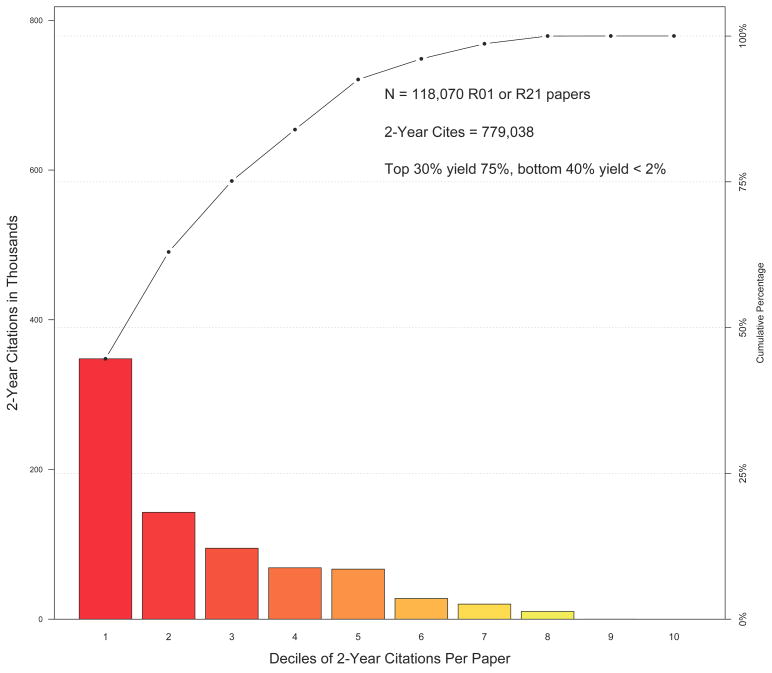
Pareto plot of 2-year citations for 118,070 papers funded by NHLBI R01 or R21 grants and published between 1990 and 2010. The x axis divides the number of papers according number of 2-year citations. The bars show the sum of 2-year citations within each decile, while the line graph shows cumulative values going from the best- to the worst producing-deciles of papers. The top three deciles (that is, the 30% most frequently cited papers) generated 75% of the citations.

