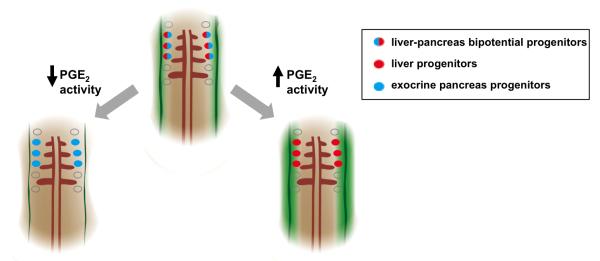
Figure 7. Model for the Role of PGE2 Activity in Liver vs. Pancreas Endoderm Specification.

A model for PGE2 regulation of endodermal specification into liver or pancreas progenitors. Bipotential endodermal cells capable of both a liver or exocrine pancreas fate (red/blue cells) have been found between somites 1-3. Levels of PGE2 (green gradient) may form a gradient with highest activity closest to the 2 bilateral stripes of cox2a (solid green bands), the rate-limiting enzyme in PGE2 synthesis. Cells closest to the highest levels of PGE2 are more likely to acquire a liver fate (red cells), whereas cells farther from the source of PGE2 acquire an exocrine pancreas fate (blue cells). Augmenting levels of PGE2 promotes a liver fate (red cells) at the cost of a pancreas fate (blue cells), whereas decreasing levels of PGE2 promotes a pancreas fate (blue cells) at the cost of a liver fate (red cells).
