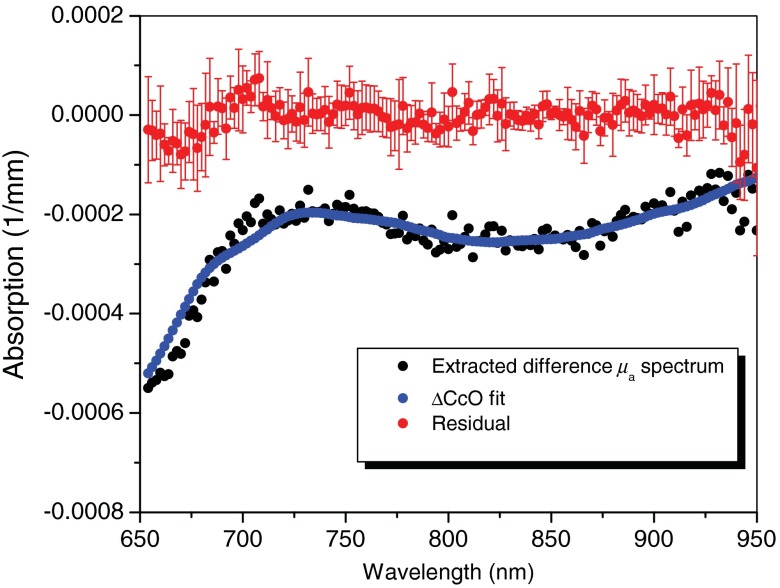
Fig. 5.
The extracted difference absorption spectra of CcO redox state (black circles), DOS fit of difference CcO redox state (blue line), and resulting fitting residual (red solid circles) after the animal was infused with 8.1 mg of sodium CN (48.6 min after CN infusion started). Change in is from DOS fitting. Mean values of fitting residual (red solid circle) and standard deviation (error bar) are also shown in this figure.

