Figure 1.
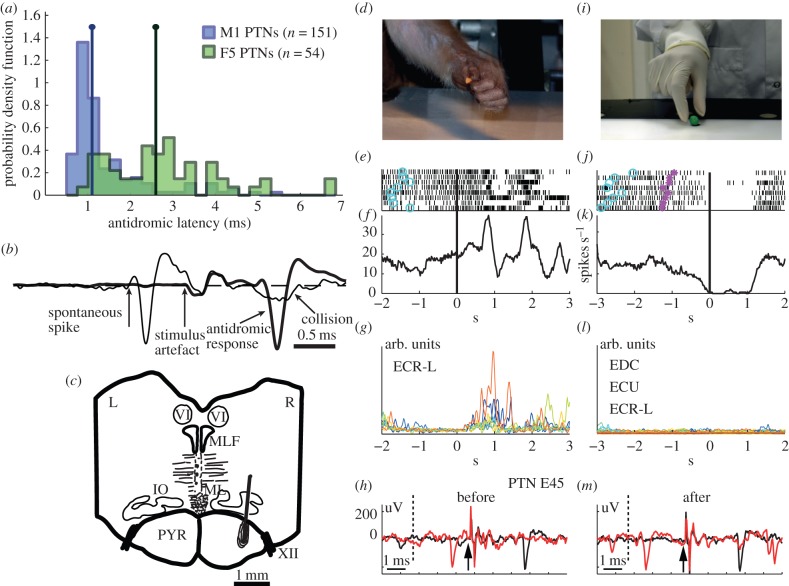
Identification of PTNs with mirror properties. (a) Probability density functions comparing antidromic latencies of identified PTNs. Distributions are shown for M1 (blue) and F5 (green) PTNs (bin width 0.25 ms). The two vertical lines correspond to the median antidromic latency for each population of PTNs (1.1 and 2.6 ms for M1 and F5, respectively). The two median values are significantly different (p < 0.0001, Wilcoxon rank-sum test) (from Vigneswaran et al. [11]). (b) Antidromic response of an M1 PTN (heavy trace, average of 40 sweeps). Arrows indicate the onset of the PT stimulus and antidromic spike. The antidromic latency of this PTN was 0.9 ms and spike duration was 0.24 ms. The thin trace shows collision of the antidromic spike with a spontaneous spike from this PTN, which occurred just before the PT stimulus (from Vigneswaran et al. [11]). (c) Transverse section through brainstem of M41, showing location of tip of posterior PT electrode on right (R) side and surrounding gliosis. PYR, pyramidal tract; IO, inferior olive; ML, medial lemniscus; MLF, medial longitudinal fasciculus; VI, abducens nucleus; XII, hypoglossal nerve. (d) Photo of monkey grasping a piece of food in a precision grip; (e,f) raster plot and averaged firing rate for an F5 PTN during self-grasp aligned to cue for onset of reach-to-grasp movement (indicated by black vertical lines). Note that there were several bursts of activity in the PTN, associated with the initial grasp of the food reward and then release of food at the mouth. Activity of ECR-L (extensor carpi radialis), one of nine simultaneously recorded EMGs is shown in (g). (i) Photo of experimenter grasping a piece of food in precision grip; (j,k) raster plot and averaged firing rate for the same F5 PTN during eight trials of observation of precision grip of food, aligned to the moment of contact of the experimenter's hand with the target object (indicated by black vertical lines). Light-blue circles on each trial indicate the beginning of baseline interval for each trial (experimenter's hand motionless in full view of monkey), and magenta asterisks indicate the beginning of experimenter's movement towards the object. In this monkey (M43), a block design was used. (l) Superimposed records of EMG activity of all eight observation trials from three extensor muscles (EDC, ECU and ECR-L). Note almost complete absence of EMG activity during action observation. Other six recorded muscles (not shown here) also did not show any significant activity during mirror testing. (h,m) Antidromic responses from the PTN in response to PT stimulation; the onset of PT stimulus is indicated by arrows, black curves are averages over tens of trials, antidromic spikes had constant latency (2.8 ms) before (h) and after (m) mirror testing; red curves show collisions when a spontaneous spike appeared after the collision interval (indicated by dotted line): the antidromic spike was collided and absent from the record.

